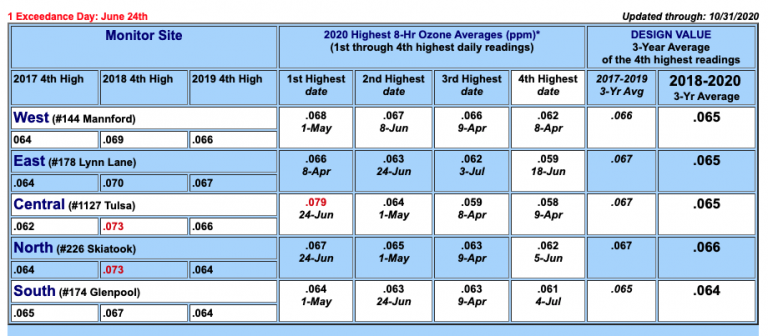
2026 Ozone Scorecard
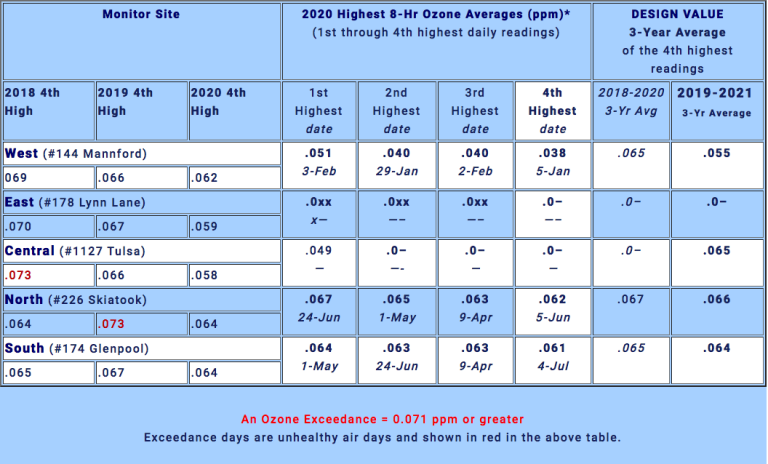
1 Exceedance Days (to date): 21-Mar Updated through: May 11, 2026, 10:00 AM View the Tulsa Area Ozone Trends Chart Monitor Site 2026 Highest 8-Hr Ozone Averages (ppm)* (1st through 4th highest daily readings) Design Value 3-Year Average of the 4th highest readings 2023 4th High 2024 4th High 2025 4th High 1st Highest date…